Level Meter Plug-in
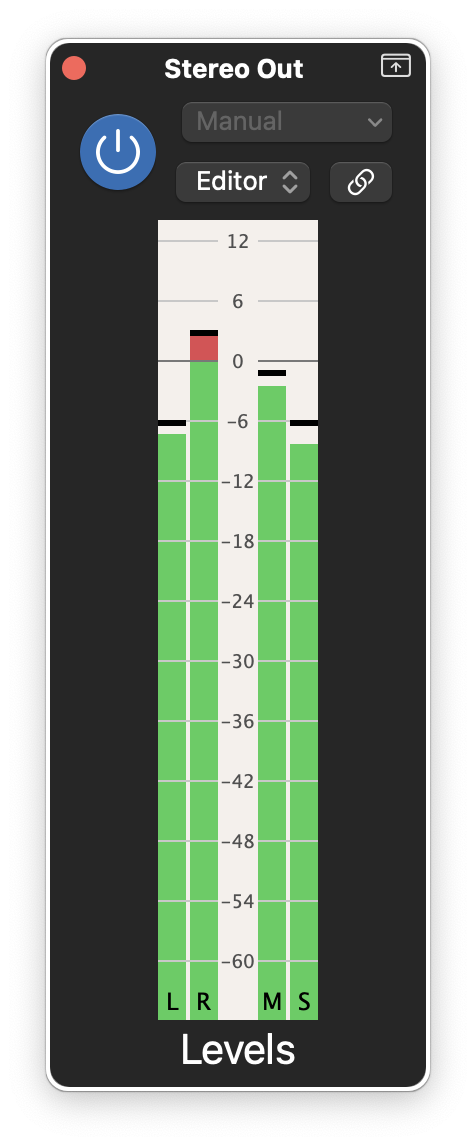
Basic digital VU meter.
I’m brushing off some of my older plug-in code in order to release it as open source.
The first is a (very) basic level metering plug-in. I mainly use this thing when testing and debugging plug-ins that don’t have a built-in level meter. It shows the peak levels for the left and right channels, as well as the mids and sides.
You can find the source code at github.com/hollance/levels.
In this blog post I will highlight some of the more interesting parts of the code.
Audio thread ⇆ UI
The audio processing code for this plug-in is really simple: Each time processBlock() is called, we measure the maximum sample value for each channel over the current block.
The incoming audio is passed straight through without modifying it, so you can safely insert this plug-in before or after other plug-ins without affecting the signal.
To pass the measured peak levels safely to the UI, we use std::atomic<float> variables. The UI runs a timer that fires 60 times per second. The timer callback reads from the atomic floats and repaints the VUMeter component.
Sounds straightforward enough. However, there is something special going on here…
Depending on the chosen block size, the UI is updated slower than the rate at which the audio is processed — 60 times per second versus hundreds or possibly thousands of times per second.
If we always put the level measured for the latest block into the std::atomic<float>, this might overwrite a larger value with a smaller value if the audio suddenly becomes quieter.
The UI should display the largest level that was measured since the last repaint, so we don’t want a smaller measurement to overwrite a larger one if processBlock() happens multiple times in between timer callbacks.
This is how we achieve that:
void update(float newValue) noexcept
{
    auto oldValue = value.load();
    while (newValue > oldValue && !value.compare_exchange_weak(oldValue, newValue));
}
The atomic value is only updated if newValue > oldValue. Rather than doing the obvious value.store(newValue), this uses a so-called CAS loop (compare and swap). CAS loops are often used to build lock-free data structures.
When the VUMetercomponent consumes the level measurement in order to draw it, it also sets the atomic back to zero using the exchange() operation:
float read() noexcept
{
    return value.exchange(0.0f);
}
This signals to the audio thread it’s OK to write smaller measurements again in the next processBlock(), since any new measurement will be greater than 0.0 if sound is playing.
By the way, the update() and read() methods live in a struct Measurement that wraps the std::atomic<float>. This is done because we have four of these — for the left channel, right channel, mids, and sides. They act independently of each other, so we want to have four separate atomic variables.
Why use a CAS loop here? The compare_exchange_weak() operation only updates the atomic to newValue if it currently is equal to oldValue. If it’s not, some other thread will have changed the atomic between the calls to value.load() and compare_exchange_weak(). When that happens, we’ll repeat the loop to try again. I first saw this trick in the source of Clean Machine.
In this plug-in, the CAS loop does not give much of an advantage over a regular store() since the UI is the only other thread that’s ever modifying the atomic and it always writes 0.0f. However, the CAS loop makes sure that, if some other thread in the mean time were to write a value larger than newValue into the atomic, this will not be blindly overwritten by update(). In that case, the atomic no longer equals oldValue and the call to compare_exchange_weak() will return false. It also loads the atomic’s current value into the oldValue variable, as that is passed by reference. Since newValue > oldValue no longer holds in that situation, the while-loop terminates and the atomic is left alone. Even though this situation should never happen here, using a CAS loop is still good practice.
Drawing decibels
The level measurements are in linear units but we want to draw them as decibels. It’s easy enough to do the conversion using juce::Decibels::gainToDecibels() but how to turn the resulting decibel values into screen coordinates?
Luckily for us, JUCE has a handy jmap() function that can be used exactly for this purpose. First we decide what the pixel positions are that correspond to our maximum decibel level (+12 dB) and minimum level (–60 dB). This is done in the component’s resized() method:
void VUMeter::resized()
{
    maxPos = 10.0f;
    minPos = float(getHeight()) - 30.0f;
}
Don’t let the names confuse you: maxPos is higher up on the screen than minPos and therefore has a smaller pixel coordinate.
Next, create a helper function to map any level in decibels to a pixel position between maxPos and minPos:
static constexpr float maxdB = 12.0f;
static constexpr float mindB = -60.0f;

int positionForLevel(float dbLevel) const noexcept
{
    return int(std::round(juce::jmap(dbLevel, maxdB, mindB, maxPos, minPos)));
}
The mapped pixel coordinate is a floating-point number, so we round it off and then cast to integer so that the lines get drawn crisp.
You can see how this function is used in the drawLevel() method of VUMeter:
void VUMeter::drawLevel(juce::Graphics& g, const Channel& channel)
{
    if (channel.level > 0.0f) {
        int y = positionForLevel(channel.leveldB);

        if (channel.leveldB > 0.0f) {
            int y0 = positionForLevel(0.0f);
            g.setColour(juce::Colour(226, 74, 81));
            g.fillRect(channel.x, y, 14, y0 - y);
            g.setColour(juce::Colour(65, 206, 88));
            g.fillRect(channel.x, y0, 14, getHeight() - y0);
        } else if (y < getHeight()) {
            g.setColour(juce::Colour(65, 206, 88));
            g.fillRect(channel.x, y, 14, getHeight() - y);
        }
    }
}
Channel is a helper object that’s used by the VUMeter component to keep track of the level information for each channel (left, right, mids, sides). drawLevel() is called four times, each time with a different Channel object.
The Channel object has a level property, which is in linear units, and also a leveldB property for the same thing but in decibels. The reason it keeps track of both is because of how the animations work (see next section). leveldB is for doing the actual drawing.
If the level in decibels is greater than 0 dB, we draw the portion above 0 dB in red and the portion below in green. For levels smaller than 0 dB, we only draw the green part. The bar always extends down to the bottom of the component. For levels lower than –60 dB, where the top of the bar falls below the bottom of the screen, nothing is drawn.
Animating the UI
When the timer callback is invoked, the following code is performed:
float newLevel = measurement.read();

if (newLevel > channel.level) {
    channel.level = newLevel;
} else {
    channel.level += (newLevel - channel.level) * levelDecay;
}
The first line reads the current value from the atomic variable (and sets it to zero). And then we animate the display:
-
If the new level is larger than the currently displayed level, immediately jump to this new level. (This is like having an instantaneous attack.)
-
If the new level is smaller, use a basic one-pole filter to do an exponential fade out of the meter. This also causes the level to smoothly drop away when you mute the track or stop playback, in which case
newLevelis0.0.
The filter coefficient for the fade out is calculated as follows:
levelDecay = 1.0f - std::exp(-1.0f / (float(refreshRate) * 0.2f));
The refreshRate is the “sample rate” of the UI thread, which is 60 Hz, since the timer callback gets triggered 60 times per second. The decay time is fixed at 200 ms, meaning that after 200 ms the level indicator has dropped to 36.8% of its previous value.
After applying this filter, we convert the channel.level value to decibels and that’s what eventually gets drawn on the screen:
if (channel.level > clampLevel) {
    channel.leveldB = juce::Decibels::gainToDecibels(channel.level);
} else {
    channel.leveldB = clampdB;
}
Here clampLevel and clampdB correspond to –120 dB, to limit how small the dB value can get. The VUMeter only draws until –60 dB but this is easily changed by changing the mindB constant.
The decay is exponential, but since we applied the filter before the conversion to decibels, the log operation in gainToDecibels() causes the animation to become linear in dB space instead of exponential. When the sound stops playing you’ll see the bar slide downwards at a constant speed, rather than starting fast and slowing down near the bottom.
Note that the timer callback doesn’t do any actual drawing, it simply calls repaint() on the component. That’s why we store the level and leveldB values for the different channels in Channel objects, so that paint() can simply draw these values — it doesn’t have to do any of the computations itself, except for translating the levels to pixel positions.
Peak indicator
In addition to the green bar that represents the current sound level, we also draw a small black line sitting on top. This peak indicator holds in place for a short while before decaying and is a common feature of digital level meters.
Essentially this works the same way as the regular levels:
if (channel.level > channel.peak) {
    channel.peak = channel.level;
    channel.peakdB = channel.leveldB;
    channel.peakHold = holdMax;
} else if (channel.peakHold > 0) {
    channel.peakHold -= 1;
} else if (channel.peakdB > clampdB) {
    // animate the channel.peak value and convert to dB
}
If the new level is larger than the previous peak, then jump to that new peak value with an instantaneous attack.
Once the new level measurement is smaller than the current peak, don’t immediately start fading out, but count down the peakHold variable until it reaches zero. holdMax is 2 times the refreshRate, meaning that the peak indicator is held in place for two seconds before it starts decaying (or when a new higher value comes in, of course).
The logic for decaying the peak indicator uses the same kind of one-pole filter we’ve seen before, but with a 500 ms decay time, so it drops slower than the regular bars.
Conclusion
I though this would be a fun little plug-in to show, since it does a few interesting things:
-
The communication between the audio thread and UI thread, using a while-loop and
compare_exchange_weak()to update the atomic value — but only if the new value is larger than the old value. -
Animating the UI using a one-pole filter, which gives an exponential curve in linear space but a constant animation speed in log space (decibels).
Note that parts of this plug-in can still be optimized. The audio processing code could be done using SIMD — although when building in release mode, the compiler may already auto-vectorize this loop. The drawing code could draw the text labels just once and only redraw the actual levels.